In 2024, parents welcomed 594,540 new additions to the family in England and Wales according to the latest statistics available.
But in the numbers show interesting trends on both a regional and authority level. So we’ve analysed and sorted the numbers to dig into what’s really happening and cherry picked the key points you should know.
Read on to see how different regions compare to one another, which authorities saw live births increase and how regions compare to their 2023 statistics.
Note: The birth statistics for 2024 presented in this post were collected from the ONS’s latest births in England and Wales release.
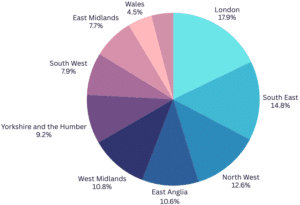
Live Birth Statistics by Region (England and Wales):
Overall, live births in England, Wales and Elsewhere increase from 591,072 to 594,677, a 0.6% increase, but represented a smaller change than the 2.3% decrease between 22-23.
In terms of where those births are happening, we’ve ranked regions in England and Wales by live births below.
Note that the highest value shown is underlined and bold.
| Region | 2024 | 2023 | 2022 | 2021 |
| 1. London | 106,140 | 104,252 | 106,696 | 110,961 |
| 2. South East | 88,148 | 88,164 | 90,589 | 94,292 |
| 3. North West | 74,646 | 73,741 | 76,399 | 78,127 |
| 4. East Anglia | 63,109 | 63,190 | 64,294 | 67,054 |
| 5. West Midlands | 64,227 | 62,126 | 63,368 | 63,846 |
| 6. East Midlands | 63,109 | 63,190 | 64,294 | 67,054 |
| 7. Yorkshire and the Humber | 54,497 | 53,991 | 55,203 | 56,377 |
| 8. South West | 47,171 | 47,564 | 48,947 | 52,278 |
| 9. Wales | 26,832 | 27,374 | 28,296 | 28,781 |
| 10. North East | 24,231 | 24,573 | 24,701 | 25,153 |
Live Births by Authority (Top 10 by Volume):
Within these regions, county councils register the most births due to their size, with 8 out of 10 of the authorities with the highest volume of live births being county councils. Birmingham have swapped places with Essex, and Staffordshire has swapped places with West Sussex since the 2023 statistics review.
| Ranking/Council | 2024 | 2023 | 2022 | 2021 |
| 1. Kent | 15,791 | 15,429 | 16,364 | 16,633 |
| 2. Birmingham | 15,561 | 14,238 | 14,482 | 14,477 |
| 3. Essex | 15,091 | 15,070 | 15,546 | 16,215 |
| 4. Hampshire | 12,370 | 12,409 | 12,838 | 13,468 |
| 5. Hertfordshire | 12,268 | 12,279 | 12,449 | 13,495 |
| 6. Lancashire | 11,754 | 11,374 | 11,754 | 12,035 |
| 7. Surrey | 11,246 | 11,474 | 11,740 | 12,451 |
| 8. Leeds | 8,337 | 8,346 | 8,617 | 8,784 |
| 9. Staffordshire | 7,668 | 7,739 | 8,021 | 8,280 |
| 10. West Sussex | 7,648 | 7,768 | 7,970 | 8,515 |
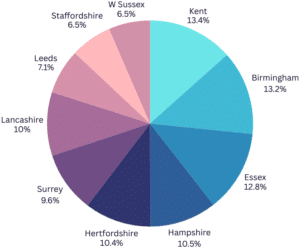
Notably, Birmingham is the only authority to have had an increase from their prior year values.
Regional live birth breakdown:
North East – 24,231 live births
The North East saw a 1.4% decrease on their statistics from 2023 (down from 24,573), the smallest decrease in England and Wales across all regions.
Sunderland, Stockton, Middlesbrough, Darlington and Gateshead all saw an increase in the number of live births seen in their authorities compared to the year prior.
The biggest net increase was seen in Stockton-On-Tees (+75), while the biggest decrease was in County Durham (-171).
| Council | 2024 | 2023 | 2022 | 2021 |
| County Durham | 4,327 | 4,498 | 4,505 | 4,592 |
| Newcastle upon Tyne | 3,007 | 3,008 | 3,070 | 2,983 |
| Sunderland | 2,676 | 2,641 | 2,593 | 2,679 |
| Northumberland | 2,356 | 2,486 | 2,464 | 2,586 |
| Stockton-on-Tees | 1,995 | 1,920 | 1,901 | 1,871 |
| Middlesbrough | 1,890 | 1,830 | 1,785 | 1,729 |
| Gateshead | 1,834 | 1,813 | 1,850 | 1,983 |
| North Tyneside | 1,814 | 1,815 | 1,898 | 2,013 |
| South Tyneside | 1,251 | 1,396 | 1,436 | 1,457 |
| Redcar and Cleveland | 1,145 | 1,195 | 1,276 | 1,281 |
| Darlington | 1,056 | 1,040 | 1,032 | 1,047 |
| Hartlepool | 880 | 931 | 891 | 932 |
North West – 74,646 live births
The North West saw an increase of 1.2% in their total live births compared to their 2023 figures (73,741).
Lancashire, Manchester, Cheshire East, Bolton, Salford, Wigan, Oldham, Tameside, Sefton, Bury, Blackburn with Darwen and Halton all saw increases in the number of live births in their authorities. The biggest increase was seen in Lancashire (+380), while the biggest decrease was seen in Knowsley (-117).
| Council | 2024 | 2023 | 2022 | 2021 |
| Lancashire | 11,754 | 11,374 | 11,754 | 12,035 |
| Manchester | 6,751 | 6,633 | 6,956 | 6,776 |
| Liverpool | 4,898 | 4,906 | 5,105 | 5,364 |
| Bolton | 3,649 | 3,396 | 3,717 | 3,453 |
| Cheshire East | 3,615 | 3,542 | 3,966 | 3,806 |
| Salford | 3,478 | 3,358 | 3,559 | 3,580 |
| Wigan | 3,310 | 3,296 | 3,557 | 3,500 |
| Oldham | 3,183 | 2,987 | 3,219 | 3,127 |
| Cheshire West and Chester | 3,032 | 3,103 | 3,439 | 3,297 |
| Stockport | 2,838 | 2,921 | 3,158 | 3,227 |
| Wirral | 2,769 | 2,813 | 2,931 | 3,024 |
| Rochdale | 2,664 | 2,675 | 2,877 | 2,746 |
| Tameside | 2,497 | 2,438 | 2,769 | 2,525 |
| Sefton | 2,392 | 2,293 | 2,488 | 2,525 |
| Cumberland | 2,256 | 2,256 | ||
| Trafford | 2,156 | 2,161 | 2,170 | 2,413 |
| Bury | 2,080 | 2,055 | 2,008 | 2,098 |
| Blackburn with Darwen | 1,939 | 1,869 | 1,856 | 1,945 |
| Warrington | 1,763 | 1,800 | 1,914 | 1,932 |
| Knowsley | 1,758 | 1,875 | 1,932 | 1,986 |
| St. Helens | 1,724 | 1,766 | 1,858 | 1,817 |
| Westmorland and Furness | 1,597 | 1,642 | ||
| Blackpool | 1,353 | 1,402 | 1,499 | 1,423 |
| Halton | 1,190 | 1,180 | 1,193 | 1,355 |
Yorkshire and the Humber – 54,497 live births
The Yorkshire and the Humber saw a drop of 0.9% in their total live births compared to their 2023 figures (53,991).
Bradford, North Yorkshire, Kirklees, Wakefield, Rotherham, York and North East Lincolnshire all saw increases in the number of live births in their authorities over the previous year.
The biggest increase in live births was seen in Kirklees (+342), while the biggest fall was seen in Doncaster (-119).
| Council | 2024 | 2023 | 2022 | 2021 |
| Leeds | 8,337 | 8,346 | 8,617 | 8,784 |
| Bradford | 7,076 | 6,862 | 6,684 | 6,828 |
| Sheffield | 5,634 | 5,649 | 5,705 | 5,723 |
| North Yorkshire | 4,824 | 4,777 | 4,934 | 5,133 |
| Kirklees | 4,716 | 4,374 | 4,702 | 4,826 |
| Wakefield | 3,661 | 3,502 | 3,646 | 3,857 |
| Doncaster | 3,124 | 3,243 | 3,350 | 3,333 |
| Kingston upon Hull, City of | 3,075 | 3,108 | 3,109 | 3,079 |
| Rotherham | 2,750 | 2,747 | 2,811 | 2,814 |
| East Riding of Yorkshire | 2,527 | 2,591 | 2,566 | 2,618 |
| Barnsley | 2,379 | 2,430 | 2,525 | 2,521 |
| Calderdale | 1,930 | 1,969 | 1,945 | 2,143 |
| York | 1,498 | 1,465 | 1,573 | 1,619 |
| North Lincolnshire | 1,491 | 1,501 | 1,549 | 1,598 |
| North East Lincolnshire | 1,475 | 1,427 | 1,487 | 1,501 |
East Midlands – 45,539 live births
The East Midlands saw a 0.9% decrease in their total live births compared to their 2023 figures (45,960).
Lincolnshire, Derby and Nottingham all saw an increase in live births within their authorities compared to their 2023 value.
The biggest increase in the East Midlands was seen in Derby (+51) while the biggest decrease was seen in West Northamptonshire (-188).
| Council | 2024 | 2023 | 2022 | 2021 |
| Nottinghamshire | 7,329 | 7,466 | 7,549 | 7,905 |
| Derbyshire | 6,920 | 6,920 | 7,217 | 7,366 |
| Leicestershire | 6,346 | 6,431 | 6,603 | 6,794 |
| Lincolnshire | 6,035 | 5,998 | 6,397 | 6,559 |
| Leicester | 4,410 | 4,492 | 4,376 | 4,172 |
| West Northamptonshire | 4,336 | 4,524 | 4,451 | 4,647 |
| North Northamptonshire | 3,553 | 3,587 | 3,714 | 3,789 |
| Nottingham | 3,392 | 3,370 | 3,404 | 3,458 |
| Derby | 2,962 | 2,911 | 2,864 | 2,896 |
| Rutland | 256 | 261 | 274 | 274 |
West Midlands – 64,227 live births
The West Midlands saw a 3.3% increase in their total live births compared to their 2023 figures (62,126), the biggest increase across all regions.
Most authorities increased in birth volumes on their previous year, excluding Staffordshire, Worcestershire and Shropshire.
The biggest increase in the West Midlands was seen in Birmingham (+1,323), while the most significant decrease was found in Staffordshire (-71).
| Council | 2024 | 2023 | 2022 | 2021 |
| Birmingham | 15,561 | 14,238 | 14,482 | 14,477 |
| Staffordshire | 7,668 | 7,739 | 8,021 | 8,280 |
| Warwickshire | 5,793 | 5,728 | 5,757 | 5,998 |
| Worcestershire | 5,134 | 5,203 | 5,334 | 5,473 |
| Sandwell | 4,669 | 4,351 | 4,330 | 4,227 |
| Coventry | 4,136 | 4,036 | 4,059 | 3,948 |
| Walsall | 3,510 | 3,347 | 3,502 | 3,529 |
| Wolverhampton | 3,450 | 3,407 | 3,323 | 3,242 |
| Dudley | 3,350 | 3,341 | 3,439 | 3,426 |
| Stoke-on-Trent | 3,118 | 2,948 | 3,059 | 2,967 |
| Shropshire | 2,406 | 2,427 | 2,567 | 2,639 |
| Solihull | 1,972 | 1,939 | 1,983 | 2,070 |
| Telford and Wrekin | 1,953 | 1,924 | 1,991 | 1,984 |
| Herefordshire | 1,507 | 1,498 | 1,521 | 1,586 |
East Anglia – 63,109 live births
East Anglia saw the smallest decrease in birth volumes between 2023 and 2024, with a decrease of 0.1% (from 63,190).
Essex, Cambridgeshire, Luton, and Peterborough all saw growth in the number of live births over this period, increasing by 386 in total.
The biggest increase however was seen in Cambridgeshire (+176), while the biggest decrease was seen in Central Bedfordshire (-183).
| Council | 2024 | 2023 | 2022 | 2021 |
| Essex | 15,091 | 15,070 | 15,546 | 16,215 |
| Hertfordshire | 12,268 | 12,279 | 12,449 | 13,495 |
| Norfolk | 7,227 | 7,405 | 7,679 | 7,853 |
| Suffolk | 6,583 | 6,615 | 6,858 | 7,026 |
| Cambridgeshire | 6,384 | 6,208 | 6,395 | 6,677 |
| Luton | 3,632 | 3,464 | 3,304 | 3,233 |
| Central Bedfordshire | 3,398 | 3,581 | 3,388 | 3,475 |
| Peterborough | 2,552 | 2,531 | 2,618 | 2,668 |
| Thurrock | 2,106 | 2,152 | 2,191 | 2,314 |
| Bedford | 2,085 | 2,095 | 1,995 | 2,223 |
| Southend-on-Sea | 1,783 | 1,790 | 1,871 | 1,875 |
London – 106,140 live births
The inner and outer London boroughs saw an increase of 1.8% over their 2023 figure of 104,252.
Most authorities saw increases in the number of births in their district during 2024 from the previous year, excluding Waltham Forest, Wandsworth, Enfield, Greenwich, Bromley, Southwark, Merton, Sutton, Kensington and Chelsea, and the City of London.
The biggest increase was seen in Tower Hamlets (+320), while the biggest decrease was seen in Waltham Forest (-131).
| Council | 2024 | 2023 | 2022 | 2021 |
| Newham | 5,518 | 5,494 | 5,598 | 5,346 |
| Croydon | 5,003 | 4,939 | 4,872 | 5,001 |
| Ealing | 4,639 | 4,441 | 4,427 | 4,397 |
| Barnet | 4,586 | 4,563 | 4,621 | 4,780 |
| Tower Hamlets | 4,471 | 4,151 | 4,127 | 4,381 |
| Brent | 4,445 | 4,347 | 4,431 | 4,427 |
| Redbridge | 4,353 | 4,108 | 4,243 | 4,275 |
| Hillingdon | 4,254 | 4,082 | 4,037 | 4,061 |
| Wandsworth | 3,848 | 3,924 | 3,812 | 4,198 |
| Waltham Forest | 3,810 | 3,941 | 4,040 | 4,136 |
| Lewisham | 3,725 | 3,586 | 3,820 | 4,024 |
| Hounslow | 3,710 | 3,577 | 3,529 | 3,678 |
| Barking and Dagenham | 3,622 | 3,407 | 3,360 | 3,255 |
| Enfield | 3,578 | 3,658 | 3,921 | 3,936 |
| Hackney | 3,559 | 3,443 | 3,482 | 3,971 |
| Greenwich | 3,512 | 3,591 | 3,760 | 3,906 |
| Bromley | 3,333 | 3,408 | 3,431 | 3,728 |
| Lambeth | 3,318 | 3,272 | 3,345 | 3,554 |
| Southwark | 3,256 | 3,265 | 3,393 | 3,525 |
| Havering | 3,235 | 3,084 | 3,089 | 3,057 |
| Harrow | 3,249 | 3,019 | 3,298 | 3,312 |
| Haringey | 3,085 | 3,064 | 3,085 | 3,376 |
| Bexley | 2,618 | 2,604 | 2,765 | 2,837 |
| Merton | 2,431 | 2,474 | 2,497 | 2,739 |
| Islington | 2,282 | 2,259 | 2,443 | 2,657 |
| Hammersmith and Fulham | 2,085 | 1,882 | 2,006 | 2,146 |
| Camden | 2,011 | 1,976 | 2,072 | 2,317 |
| Sutton | 2,002 | 2,107 | 2,220 | 2,347 |
| Westminster | 1,921 | 1,909 | 1,967 | 2,110 |
| Richmond upon Thames | 1,719 | 1,674 | 1,827 | 2,120 |
| Kingston upon Thames | 1,626 | 1,607 | 1,726 | 1,849 |
| Kensington and Chelsea | 1,291 | 1,339 | 1,387 | 1,455 |
| City of London | 45 | 57 | 65 | 60 |
South East – 88,148 live births
The South East saw the smallest decrease from the year prior across all regions, with an overall decrease of 0.01% (88,164).
Kent, Oxfordshire, Buckinghamshire, Milton Keynes, Southampton, Slough, Brighton and Hove, Windsor and Maidenhead, and Bracknell Forest all saw live births increase in their authorities compared to the year prior.
Kent saw the greatest increase within the region (362), while Surrey saw the biggest decrease (-228).
| Council | 2024 | 2023 | 2022 | 2021 |
| Kent | 15,791 | 15,429 | 16,364 | 16,633 |
| Hampshire | 12,370 | 12,409 | 12,838 | 13,468 |
| Surrey | 11,246 | 11,474 | 11,740 | 12,451 |
| West Sussex | 7,648 | 7,768 | 7,970 | 8,515 |
| Oxfordshire | 7,153 | 7,144 | 7,201 | 7,380 |
| Buckinghamshire | 5,616 | 5,585 | 5,533 | 5,893 |
| East Sussex | 4,252 | 4,321 | 4,411 | 4,549 |
| Milton Keynes | 3,256 | 3,170 | 3,073 | 3,329 |
| Medway | 3,138 | 3,243 | 3,293 | 3,272 |
| Southampton | 2,546 | 2,541 | 2,660 | 2,803 |
| Slough | 2,404 | 2,255 | 2,293 | 2,116 |
| Brighton and Hove | 2,094 | 2,061 | 2,099 | 2,304 |
| Portsmouth | 2,039 | 2,147 | 2,140 | 2,176 |
| Reading | 1,973 | 1,975 | 2,077 | 2,026 |
| Wokingham | 1,648 | 1,668 | 1,672 | 1,821 |
| West Berkshire | 1,363 | 1,435 | 1,490 | 1,507 |
| Windsor and Maidenhead | 1,358 | 1,333 | 1,356 | 1,526 |
| Bracknell Forest | 1,334 | 1,287 | 1,409 | 1,495 |
| Isle of Wight | 919 | 919 | 970 | 1,028 |
South West – 47,171 live births
The South West saw only a small drop of ~400 live births on the prior year (47,564, 0.82% decrease).
The South West saw increases in Bristol, Bournemouth, Christchurch and Poole, Dorset, Swindon, and Plymouth.
Bristol saw the biggest increase in live births (210), while Cornwall saw the biggest decrease (-264) over the time period.
| Council | 2024 | 2023 | 2022 | 2021 |
| Gloucestershire | 5,826 | 5,839 | 5,834 | 6,138 |
| Devon | 5,818 | 6,007 | 6,132 | 6,644 |
| Bristol, City of | 4,981 | 4,771 | 5,048 | 5,430 |
| Somerset | 4,621 | 4,734 | 4,817 | 5,063 |
| Wiltshire | 4,215 | 4,350 | 4,503 | 4,593 |
| Cornwall and Isles of Scilly | 4,082 | 4,346 | 4,456 | 4,834 |
| Bournemouth, Christchurch and Poole | 3,211 | 3,109 | 3,332 | 3,668 |
| South Gloucestershire | 2,868 | 2,907 | 2,925 | 3,055 |
| Dorset | 2,535 | 2,412 | 2,615 | 2,755 |
| Swindon | 2,413 | 2,371 | 2,391 | 2,580 |
| Plymouth | 2,349 | 2,341 | 2,409 | 2,556 |
| North Somerset | 1,836 | 1,836 | 1,842 | 2,071 |
| Bath and North East Somerset | 1,484 | 1,581 | 1,633 | 1,777 |
| Torbay | 932 | 960 | 1,010 | 1,114 |
Wales – 26,832 live births
Compared to their 2032 figure, Wales saw a decrease of around 500 live births (27,374), a decrease of 1.9%.
Cardiff, Newport, Ceredigion, and Isle of Anglesey all saw their live birth figures grow from 2023.
The biggest increase in live births was seen in Cardiff (+135), while the biggest decrease was seen in Carmarthenshire (-123).
| Council | 2024 | 2023 | 2022 | 2021 |
| Cardiff | 3,626 | 3,491 | 3,597 | 3,818 |
| Rhondda Cynon Taf | 2,080 | 2,126 | 2,300 | 2,262 |
| Swansea | 2,021 | 2,100 | 2,035 | 2,067 |
| Newport | 1,899 | 1,827 | 1,901 | 1,890 |
| Caerphilly | 1,477 | 1,584 | 1,559 | 1,616 |
| Carmarthenshire | 1,468 | 1,591 | 1,620 | 1,540 |
| Flintshire | 1,331 | 1,343 | 1,420 | 1,470 |
| Bridgend | 1,231 | 1,294 | 1,337 | 1,370 |
| Wrexham | 1,222 | 1,237 | 1,249 | 1,266 |
| Neath Port Talbot | 1,200 | 1,217 | 1,299 | 1,249 |
| Vale of Glamorgan | 1,122 | 1,139 | 1,204 | 1,205 |
| Pembrokeshire | 940 | 945 | 980 | 1,010 |
| Gwynedd | 945 | 998 | 997 | 1,039 |
| Powys | 919 | 945 | 990 | 1,054 |
| Torfaen | 879 | 922 | 948 | 943 |
| Conwy | 803 | 867 | 926 | 921 |
| Denbighshire | 780 | 814 | 870 | 919 |
| Monmouthshire | 676 | 715 | 742 | 727 |
| Blaenau Gwent | 632 | 666 | 670 | 673 |
| Merthyr Tydfil | 558 | 566 | 610 | 614 |
| Ceredigion | 520 | 501 | 477 | 536 |
| Isle of Anglesey | 503 | 486 | 565 | 592 |
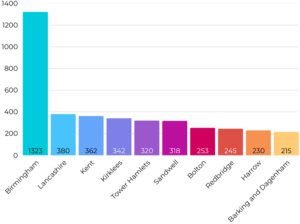
Which council saw the biggest rise in live births?
A total of 34 authorities saw their live births grow between 2023 and 2024 across England and Wales.
In terms of increasing by the most live births, Birmingham saw 1,323 new arrivals, closely followed by Lancashire (380) and Kent (362).
Looking for an all-in-one registrars system?
Stopford deliver market-leading registration solutions and are used by over half of all authorities in England and Wales.
Looking to take the next step? Get in touch via our contact page to arrange your free demo.