As we all know, 2020 was not an easy year for registration services. Teams were forced to adapt their working conditions, postpone appointment types to accommodate the surge in deaths, and manage the significant pressure to reduce backlogs in-between spikes.
The government statistics for birth registrations in 2020 were released in August last year, highlighting the volume of births that registrars recorded in different parts of England and Wales and by authority type, whether that be county, metropolitan, unitary, Welsh, or London borough.
With this data, let’s take a look back at the volume of births that took place by council type in 2020, establish trends, and see how the authorities with the biggest volumes compared to their performance in 2019.
County Councils – 207,224 births (total)
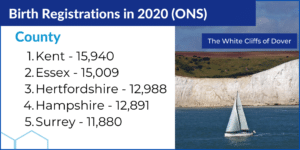
Registrars in county council authorities had a busy time in 2020, registering a whopping 207,224 births. The only two-tier authority type covered in this post, county councils frequently post larger volumes than others due to the areas they cover, handling items like registrations and health, while leaving items like planning to their local district councils.
In 2020, the services receiving the highest volume of births, which were notably based in the South of England, saw a reduction in the volume of births in comparison to 2019, with the percentage change shown in brackets. Kent also represents the highest volume of births in England for 2020 across all other council types.
Of those stats, our top 5 for 2020 looks like this –
1. Kent – 15,940 (-3.61%)
2. Essex – 15,009 (-5.69%)
3. Hertfordshire – 12,988 (-3.91%)
4. Hampshire – 12,891 (-3.2%)
5. Surrey – 11,880 (-2.55%)
Metropolitan Districts – 134,088 births (total)
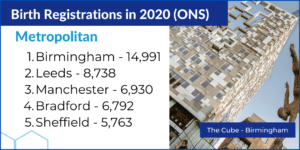
Covering the largest urban areas in England outside of London, metropolitan authorities have continued to deliver services to a significant amount of the population, delivering 134,088 births in 2020. The top 5 had strong showings, with Birmingham volumes only just behind their county council counterparts Kent and Essex. The metropolitan districts were also spearheaded by councils in the north of England, a direct contrast from the county council findings.
Of those stats, our top 5 for 2020 looks like this –
1. Birmingham – 14,991 (-3.17%)
2. Leeds – 8,738 (-5.75%)
3. Manchester – 6,930 (-4.13%)
4. Bradford – 6,792 (-6.57%)
5. Sheffield – 5,763 (-2.7%)
Unitary Districts – 132,181 births (total)
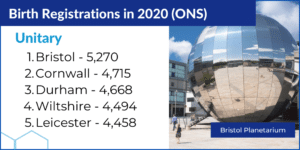
Comprised of 55 councils, unitary authorities used to be two-tier authorities (county and district or equivalent), but because of reform, have been merged. Because of this, there are a mix of authorities that cover the scope of a county council, and even ones that could conceivably be deemed as metropolitan councils as unitary authorities. In 2020, these authorities registered 132,181 births in total, just shy of the total volume received in metropolitan areas.
Of those stats, our top 5 for 2020 looks like this –
1. Bristol – 5,270 (-5.16%)
2. Cornwall – 4,715 (-2.05%)
3. Durham – 4,668 (-2.05%)
4. Wiltshire – 4,494 (-5.34%)
5. Leicester – 4,458 (-3.54%)
London Boroughs – 111,688 births (total)
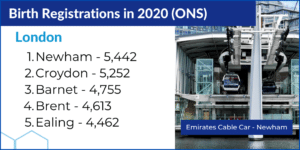
The last of the English authorities covered, London boroughs break up the large population of London into 32 distinct councils and the City of London. The 2020 statistics highlight births occurring in greater volumes predominantly outside of the inner-most part of London. It’s also notable that boroughs by size is not linked to more births, with Newham in top spot only being the 15th largest borough by area (London Councils)
Of those stats, our top 5 for 2020 looks like this –
1. Newham – 5,442 (-0.91%)
2. Croydon – 5,252 (-0.98%)
3. Barnet – 4,755 (-4.38%)
4. Brent – 4,613 (-6.22%)
5. Ealing – 4,462 (-6.9%)
Wales – 28,638 births (total)
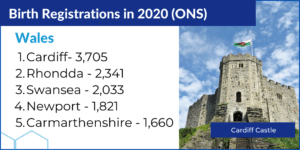
Made up of 22 single-tier authorities, Welsh registrars clocked in over 28,000 births during the pandemic year. One point to take away from the list below is the trend for births being higher in the lower half of Wales, with all 5 authorities being located in the South. Carmarthenshire also recorded the only increase in births compared to other top 5 areas listed in this post, with a jump of 0.24% on their 2019 figure.
Of those stats, our top 5 for 2020 looks like this –
1. Cardiff – 3,705 (-0.88%)
2. Rhondda – 2,341 (-5.64%)
3. Swansea – 2,033 (-9.84%)
4. Newport – 1,821 (-7.79%)
5. Carmarthenshire – 1,660 (0.24%)
Regional Birth Statistics –
In addition to the above, our analysis shows a decrease between 2019 and 2020 across all regions.
- North East: 24,915 (2020) vs. 25,742 (2019): -3.21%
- North West: 76,329 (2020) vs. 80,020 (2019): -4.61%
- South East: 90,864 (2020) vs. 93,664 (2019): -2.99%
- South West: 50,458 (2020) vs. 52,510 (2019): -3.90%
- West Midlands: 63,748 (2020) vs. 65,982 (2019): -3.38%
- East Midlands: 46,950 (2020) vs. 48,986 (2019): -4.15%
- East Anglia: 64,313 (2020) vs. 67,409 (2019): -4.59%
- Yorks and Humber: 55,916 (2020) vs. 58,281 (2019): -4.05%
- London: 111,688 (2020) vs. 119,916 (2019): -6.86%
- Wales: 28,683 (2020) vs 29,704 (2019): -3.43%
Looking for more to help your registration service?
Check out our registration solutions page to see more about our online booking, certificate management, and celebrant journey solutions.
Already have online booking? See how you can expand the functionality of agenda for registrars with everything from mobile check-in to online document uploads on our extensions page.