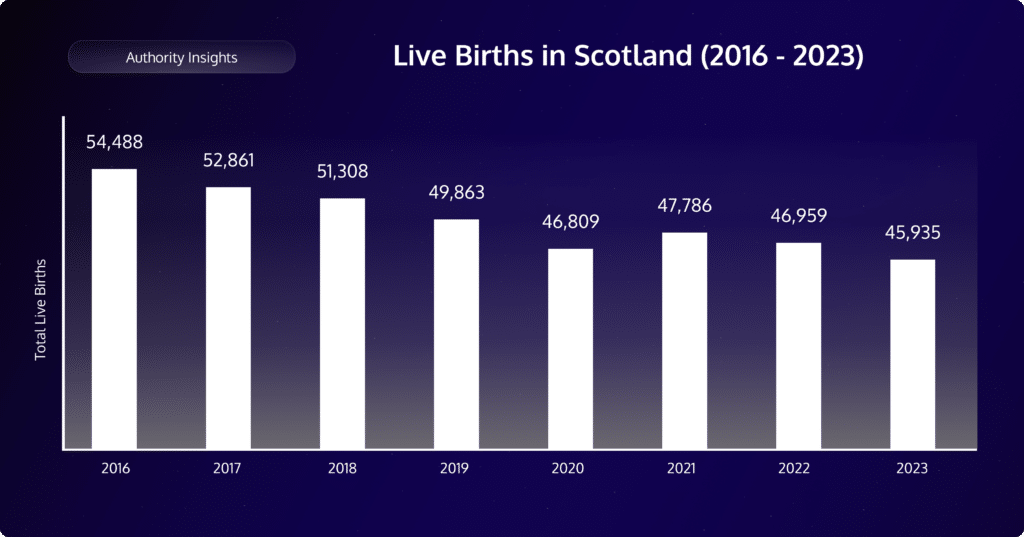
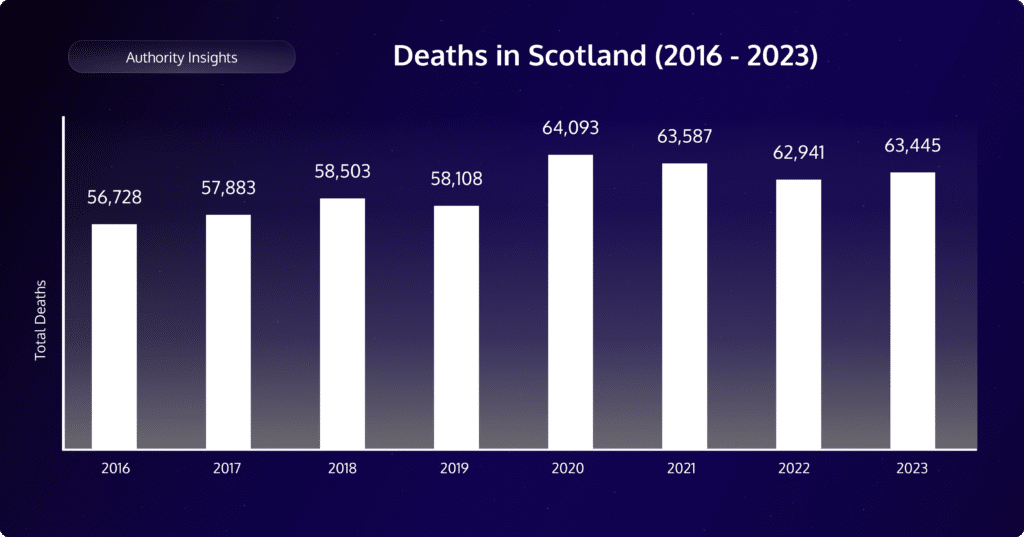
As is the case across the world, Scotland’s demographic landscape is constantly shifting.
Whether you’re curious about how birth rates are changing, the number of people getting married vs entering a civil partnership, or which areas are seeing the biggest changes in their demographics, we’ve analysed the latest available statistics from the National Records of Scotland to bring you a neat rundown of the biggest talking points.
Dive into Scotland’s vital statistics for 2023, exploring the key trends and insights that shape the nation’s demographic landscape.
Scotland Vital Statistics 2023:
Declining Live Births

Breakdown:
- In 2023, Scotland registered 45,935 live births, marking a 2% decrease compared to 2022.
- This figure represents the lowest annual total since records began (1974).
- The last time Scotland experienced more births than deaths was in 2014.
| Ranking/Council | 2023 | 2022 | % Change |
| 1. Glasgow | 5,977 | 6,112 | -2.21% |
| 2. Edinburgh | 4,194 | 4,405 | -4.79% |
| 3. North Lanarkshire | 3,073 | 3,146 | -2.32% |
| 4. South Lanarkshire | 3,048 | 3,163 | -3.64% |
| 5. Fife | 2,939 | 2,990 | -1.71% |
| 6. Aberdeen City | 2,092 | 1,939 | 7.89% |
| 7. Aberdeenshire | 2,072 | 2,159 | -4.03% |
| 8. West Lothian | 1,828 | 1,660 | 10.12% |
| 9. Highland | 1,788 | 1,909 | -6.34% |
| 10. Renfrewshire | 1,663 | 1,754 | -5.19% |
| 11. Falkirk | 1,316 | 1,413 | -6.86% |
| 12. Dundee | 1,315 | 1,340 | -1.87% |
| 13. Perth and Kinross | 1,133 | 1,153 | -1.73% |
| 14. Dumfries and Galloway | 1,123 | 1,093 | 2.74% |
| 15. East Ayrshire | 1,042 | 1,019 | 2.26% |
Biggest increases in births registered:
- South Ayrshire = 10.28%
- West Lothian = 10.12%
- Aberdeen City= 7.89%
Biggest decreases in births registered:
- Shetland Islands = -14.49%
- Angus = -10.57%
- East Lothian = -8.12%
Deaths Registered See a Small Increase

Breakdown:
- In 2023, Scotland recorded 63,445 deaths, a 1% increase from 2022.
- This was relatively even across genders, with women representing 50.06% and men representing 49.94%.
- The total number of deaths is the third highest since the year 2000, only surpassed by 2020 (64,093) and 2021 (63,587).
| Ranking/Council | 2023 | 2022 | % Change |
| 1. Glasgow | 6,477 | 6,501 | -0.37% |
| 2. Edinburgh | 4,780 | 4,761 | 0.4% |
| 3. Fife | 4,582 | 4,560 | 0.48% |
| 4. North Lanarkshire | 4,072 | 3,876 | 5.06% |
| 5. South Lanarkshire | 4,014 | 3,818 | 5.13% |
| 6. Highland | 2,841 | 2,940 | -3.37% |
| 7. Aberdeenshire | 2,719 | 2,615 | 3.98% |
| 8. Aberdeen | 2,255 | 2,248 | 0.31% |
| 9. Renfrewshire | 2,195 | 2,130 | 3.05% |
| 10. Dumfries and Galloway | 2,145 | 2,185 | -1.83% |
| 11. North Ayrshire | 1,899 | 1,916 | -0.89% |
| 12. Falkirk | 1,894 | 1,964 | -3.56% |
| 13. West Lothian | 1,884 | 1,798 | 4.78% |
| 14. Perth and Kinross | 1,870 | 1,922 | -2.71% |
| 15. Dundee | 1,811 | 1,732 | 4.56% |
Biggest decreases in deaths registered:
- Midlothian = -9.07%
- Na h-Eileanan = -5.75%
- Falkirk = -3.56%
Biggest increases in deaths registered:
- Shetland Islands = 9.57%
- East Renfrewshire = 6.27%
- Moray = 5.63%
Marriage Trends: Returning to Pre-Pandemic Levels
Breakdown:
- Scotland saw 26,753 marriages in 2023, an 11% decrease from 2022.
- This number is close to the pre-pandemic figure of 26,007 marriages in 2019, indicating normalisation following the immediate post-pandemic surge in weddings.
| Ranking/Council | 2023 | 2019 | % Change |
| 1. Dumfries and Galloway | 4,751 | 4,108 | 15.65% |
| 2. Edinburgh | 2,688 | 2,618 | 2.67% |
| 3. Glasgow | 2,027 | 2,295 | -11.67% |
| 4. Highland | 1,689 | 1,487 | 13.58% |
| 5. Fife | 1,517 | 1,490 | 1.81% |
| 6. Aberdeenshire | 1,176 | 1,164 | 1.03% |
| 7. Perth and Kinross | 1,017 | 959 | 6.04% |
| 8. Argyll and Bute | 962 | 995 | -3.31% |
| 9. South Lanarkshire | 923 | 1,038 | -11.07% |
| 10. South Ayrshire | 792 | 793 | -0.12% |
There are a few authorities though who have seen big changes in marriage volumes since 2019:
Biggest increases in marriages:
- East Dunbartonshire = 62.12%
- East Renfrewshire = 61.64%
- Orkney Islands = 16.88%
Biggest decreases in marriages:
- Falkirk = -19.37%
- Stirling = -16.06%
- Clackmannanshire = -15.59%
In terms of a breakdown of marriages by type, of the 26,753 marriages, 54% were conducted as religious or other belief ceremonies, with the rest being mostly comprised of register office or other civil marriage ceremonies.
| Marriage Type | Marriage Subtype | Volume |
| All Marriages | 26,753 | |
| Civil Marriages | 12,251 | |
| Registration Office | 6,224 | |
| Other Civil Marriages | 6,027 | |
| Hospitals, care homes etc. | – | |
| Irregular Marriages | 1 | |
| All Religious Forms and Other Beliefs | 14,502 |
Civil Partnerships on the Rise: A Closer Look
Breakdown:
- 2023 saw 719 civil partnerships in Scotland, the highest number since 2006.
- Of these, 82% were mixed-sex partnerships, reflecting how the change of law has seen different couples enter this type of union instead of marriage.
- Many authorities saw exceptional increases from their pre-pandemic figures, many recording 3-figure increases.
| Ranking/Council | 2023 | 2019 | % Change |
| 1. Edinburgh | 189 | 23 | 721.74% |
| 2. Glasgow | 89 | 17 | 423.53% |
| 3. Dumfries and Galloway | 46 | 5 | 820% |
| 4. Fife | 45 | 2 | 2150% |
| 5. Highland | 41 | 6 | 583.33% |
What’s important to note however is the possibility that this is continuing to be driven by a post-COVID boom in marriages and civil partnerships (due to the scale of the percentage increase) and this should be factored in when considering if this will be sustained in the long term.
Ready to transform the way you manage your service?
Book a no-obligation discovery call to talk through your registration team’s challenges!